At Code Connect we’re developing Visual Studio extensions. We use various configurations of virtual machines to make sure that the extensions work on client machines. In one case a bug was reproducible only in Visual Studio 2013 on one of the virtual machines. It was fixed through remote debugging connection to a virtual machine.
Remote debugging is very straightforward but requires a non trivial setup:
Download remote debugging tools
You must install remote debugging tools on the debugged machine for the exact version of Visual Studio that you have installed on your host machine. 2015 RC, 2015 RC2 and future 2015 all have different remote tools. I got mine from Visual Studio download page under Additional Tools > Remote Tools for Visual Studio 2015 RC.
Create an administrator user for use with the debugger
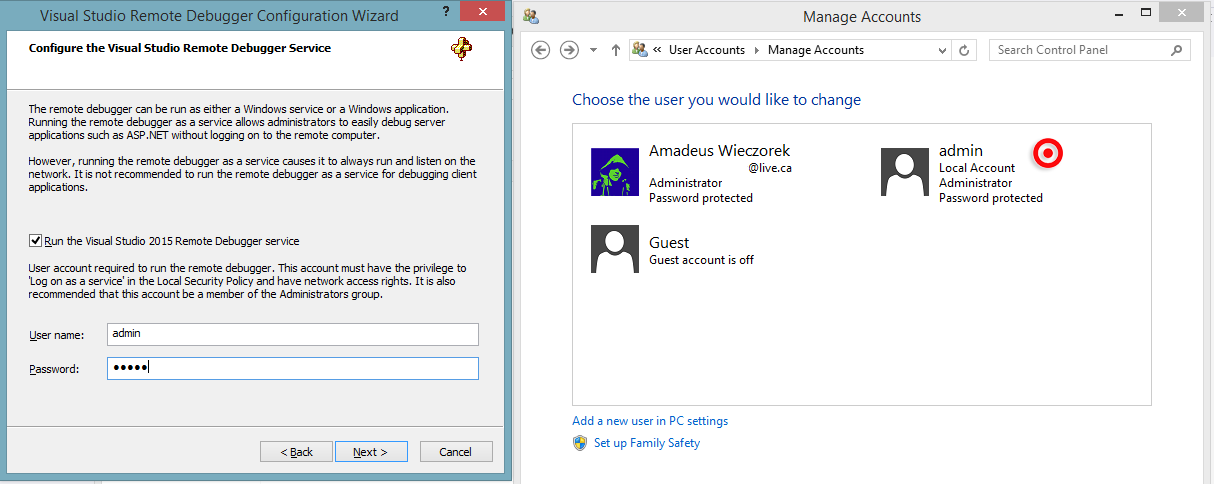
The Visual Studio Remote Debugger Configuration Wizard will ask you for an user account with privilege to Log on as a service, network access rights, and if possible, administrative privileges. I log in to my Windows 8 machines using hotmail login, and I don’t know what’s the user name for my account. So I created a new user with name admin.
Psst! Let me know if you know a way to get name for user logged in via Microsoft Account.
Grant right to log in as a service
After creating an user,
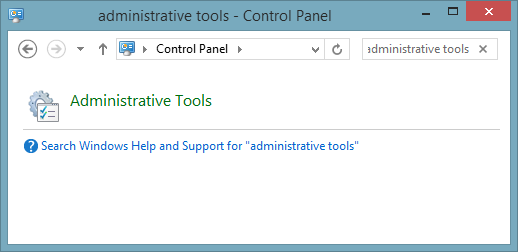
- Launch
Administrative Toolsdirectly or from control panel, and go toLocal Security Policy
In the console tree, double-click Local Policies, and then click User Rights Assignment.
In the details pane, double-click Log on as a service.
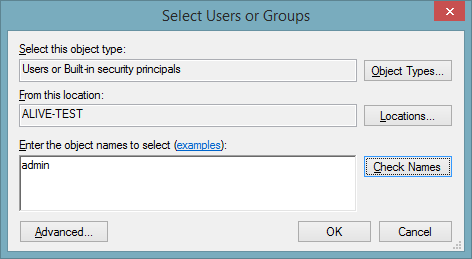
Click Add User or Group, and then add the appropriate account: simply type the name of the user and click
Check Namesto validate it.
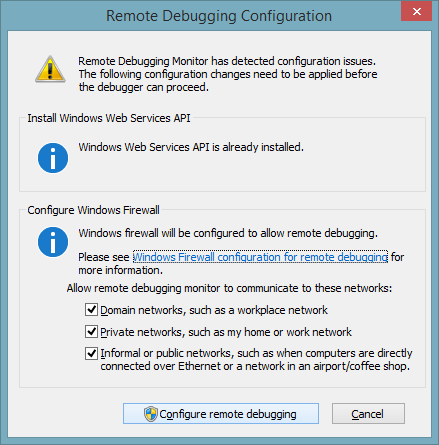
Install remote debugging tools
When you first run the tools, you may receive information that the firewall settings will change. Proceed.
Next, provide credentials of the user that you’ve created earlier
Continue through the wizard, and you should be set up!
Start the debugging session
Start Visual Studio in the remote machine. In your development Visual Studio, go to Debug > Attach to Process... and click Find... to find remote debuggers on your network.
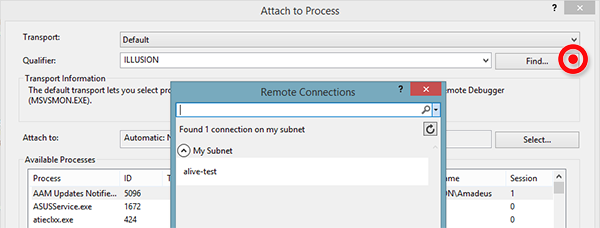
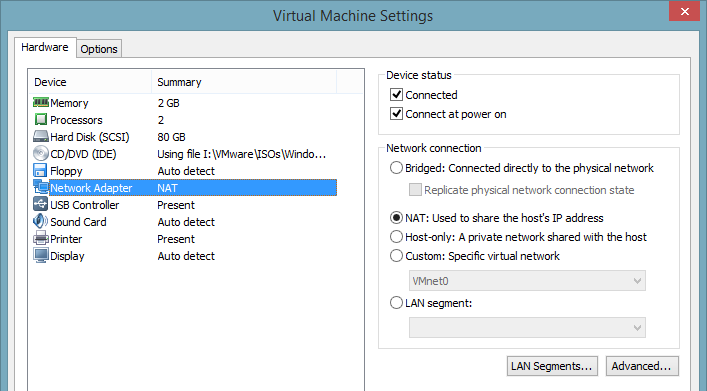
If you don’t see your virtual machine there, check network connectivity - see if you can ping the VM from the host and vice versa.
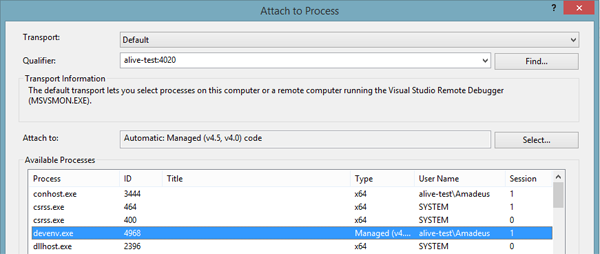
If you see your virtual machine, connect to it, and then find the process that you want to attach to. Visual Studio extensions live within the Visual Studio process devenv.exe
Debugging VS Extension’s initialization code
The extension I’m working on has its Package decorated with attribute [ProvideAutoLoad(UIContextGuids80.SolutionExists)] which causes Visual Studio to start the extension when a solution first loads. This gives us a convenient opportunity to attach to a running devenv.exe process and debug the initialization of the extension.
Initially, before you load a solution, the breakpoint icons will be hollow.

As soon as you load a solution, Visual Studio will load your extension and the breakpoint will be hit.

Congratulations! You are now debugging your extension inside Visual Studio inside the virtual machine!
Troubleshooting: establish connectivity
If the host Visual Studio can’t detect the remote debugger in the virtual machine, see if you can ping the VM from the host and vice versa. I couldn’t get it to work at first, but after restarting both the host and the virtual machine, I could connect on default settings: